
The investment strategy of the PV Buyback combines the results of four research papers published by the fund managers :
“Market underreaction to open market share repurchases“ - Journal of Financial Economics - 1995 - Ikenberry, Lakonishok and Vermaelen
“The nature and persistence of buyback anomalies“ - Review of Financial Studies - 2009 - Peyer and Vermaelen
"Are buybacks good for long- term shareholder value : evidence from buybacks around the world" - Journal of Financial and Quantitative Analysis - 2018 - Manconi, Peyer and Vermaelen
"Volatility and the Buyback Anomaly" - Journal of Corporate Finance - 2017 - Evegeniou, Junqué de Fortuny, Nassuphis and Vermaelen
"Buyback Derangement Syndrome" - Journal of Portfolio Management - 2018 - Asness, Hazelkorn and Richardson
Market underreaction to open market share repurchases
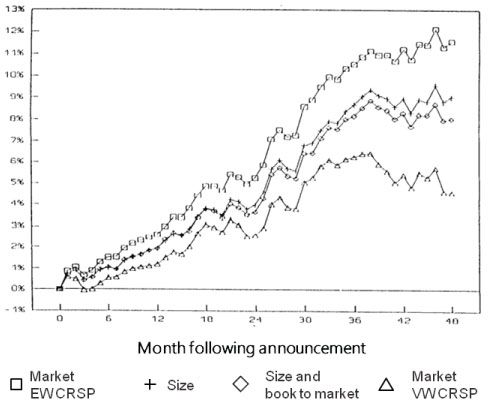
The first research consisted of an empirical test performed in 1995
To test whether share repurchase announcements would generated abnormal return, they use a sample of 1239 open market repurchase announcements between 1980 and 1990 and observed the return over a period of 4 years following the announcements of the programs
4 different methods were use to calculate abnormal return :
- Market adjusted returns using EW CRS index
- Size-adjusted returns
- Size and book-to-market returns
- Market adjusted returns using VW CRSP index
The results vary from one method to the other but consistently show excess return of up to 12 %
The nature and persistence of buyback anomalies
Theo Vermaelen and Urs Peyer determined a set of criteria allowing to identify buyback programs motivated by undervaluation
- Value stocks
- Small stocks
- When the management states they are buying back shares because they are «undervalued»
- When the stock has been beaten up
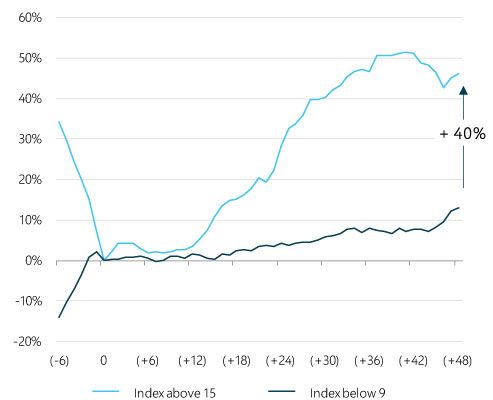
Peyer – Vermaelen (2009) combined all these criteria in an Undervaluation Index that was then tested using post-ILV data (1991-2002), or 3481 observations
As a result, they observed that stocks with a high undervaluation index (>15) could generated annualized abnormal returns of circa 12 % over a period of 48 months after a buyback announcement
Stocks with a low undervaluation index (<9) generated annualized abnormal returns of only 3%
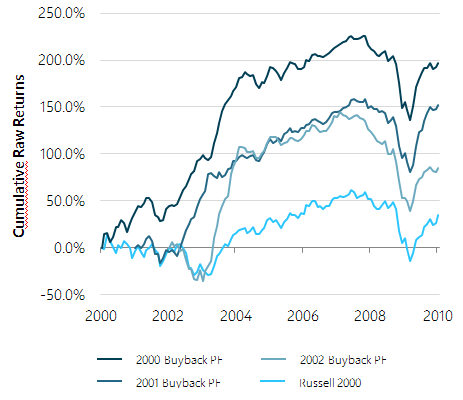
Back testing
Applied between 2000 and 2009, the investment strategy of the PV Buyback USA Fund would have largely beaten the Russell 2000
Starting in January 2000 ending December 2009 this back tested buyback strategy earned a buy and hold return of 197 %, beating the Russell 2000 by 163 %
Starting in January 2001 ending December 2009 the buyback strategy earned a return of 153 % beating the Russell 2000 by 115 %
Starting in January 2002 ending December 2009 the buyback strategy earned a return of 85 %, beating the Russell 2000 by 50 %
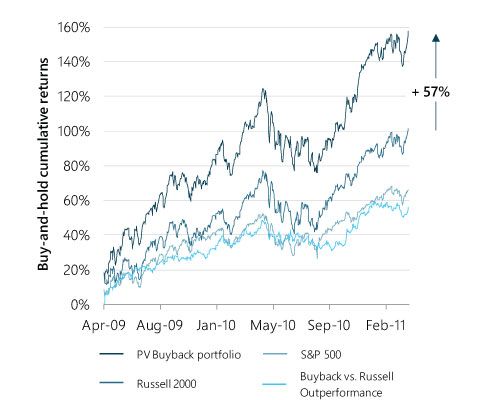
Front Testing
More recently, the buyback strategy was front-tested over 2 years.
In April 2009, Theo vermaelen and Urs Peyers picked 25 stocks their undervaluation index as well as other non-quantitative considerations. The portfolio compositions were made publicly available on the INSEAD knowledge website at the beginning of the portfolio selection.
After 2 years, this buyback portfolio would have generated a return of 162%, beating the Russell by 57%
The following graphs and tables show the results after 2 years for the April 2009 portfolio
1) Annualised return
2) Beta of the fund with respect to respective indexes
3) Correlation of the fund with respect to respective indexes